Search
Post-tuberculosis (TB) sequelae present a significant challenge in the management of TB survivors, often leading to persistent health issues even after successful treatment. Identifying risk factors associated with post-TB sequelae is important for improving outcomes and quality of life of TB survivors. This systematic review and meta-analysis aims to identify risk factors associated with long-term physical sequelae among TB survivors.
Fertility rates are key indicators of population health and demographic change, influencing economic development, healthcare planning, and social policies. Understanding subnational variation in fertility rate is important for effective geographical targeting and policy prioritization. This study aimed to identify geographic variation, trends, and determinants of fertility rates in Ethiopia over the past two decades.
Climatic conditions are a key determinant of malaria transmission intensity, through their impacts on both the parasite and its mosquito vectors. Mathematical models relating climatic conditions to malaria transmission can be used to develop spatial maps of climatic suitability for malaria. These maps underpin efforts to quantify the distribution and burden of malaria in humans, enabling improved monitoring and control.
Strongyloidiasis, caused by the soil-transmitted helminth Strongyloides stercoralis, remains a neglected public health issue in Australia, particularly among remote Aboriginal and Torres Strait Islander communities. This study aimed to map the spatial distribution of strongyloidiasis and investigate associated socioecological factors to identify high-risk areas and guide targeted interventions in Australia.
Malaria imposes a significant global health burden and remains a major cause of child mortality in sub-Saharan Africa. In many countries, malaria transmission varies seasonally. The use of seasonally-deployed interventions is expanding, and the effectiveness of these control measures hinges on quantitative and geographically-specific characterisations of malaria seasonality.
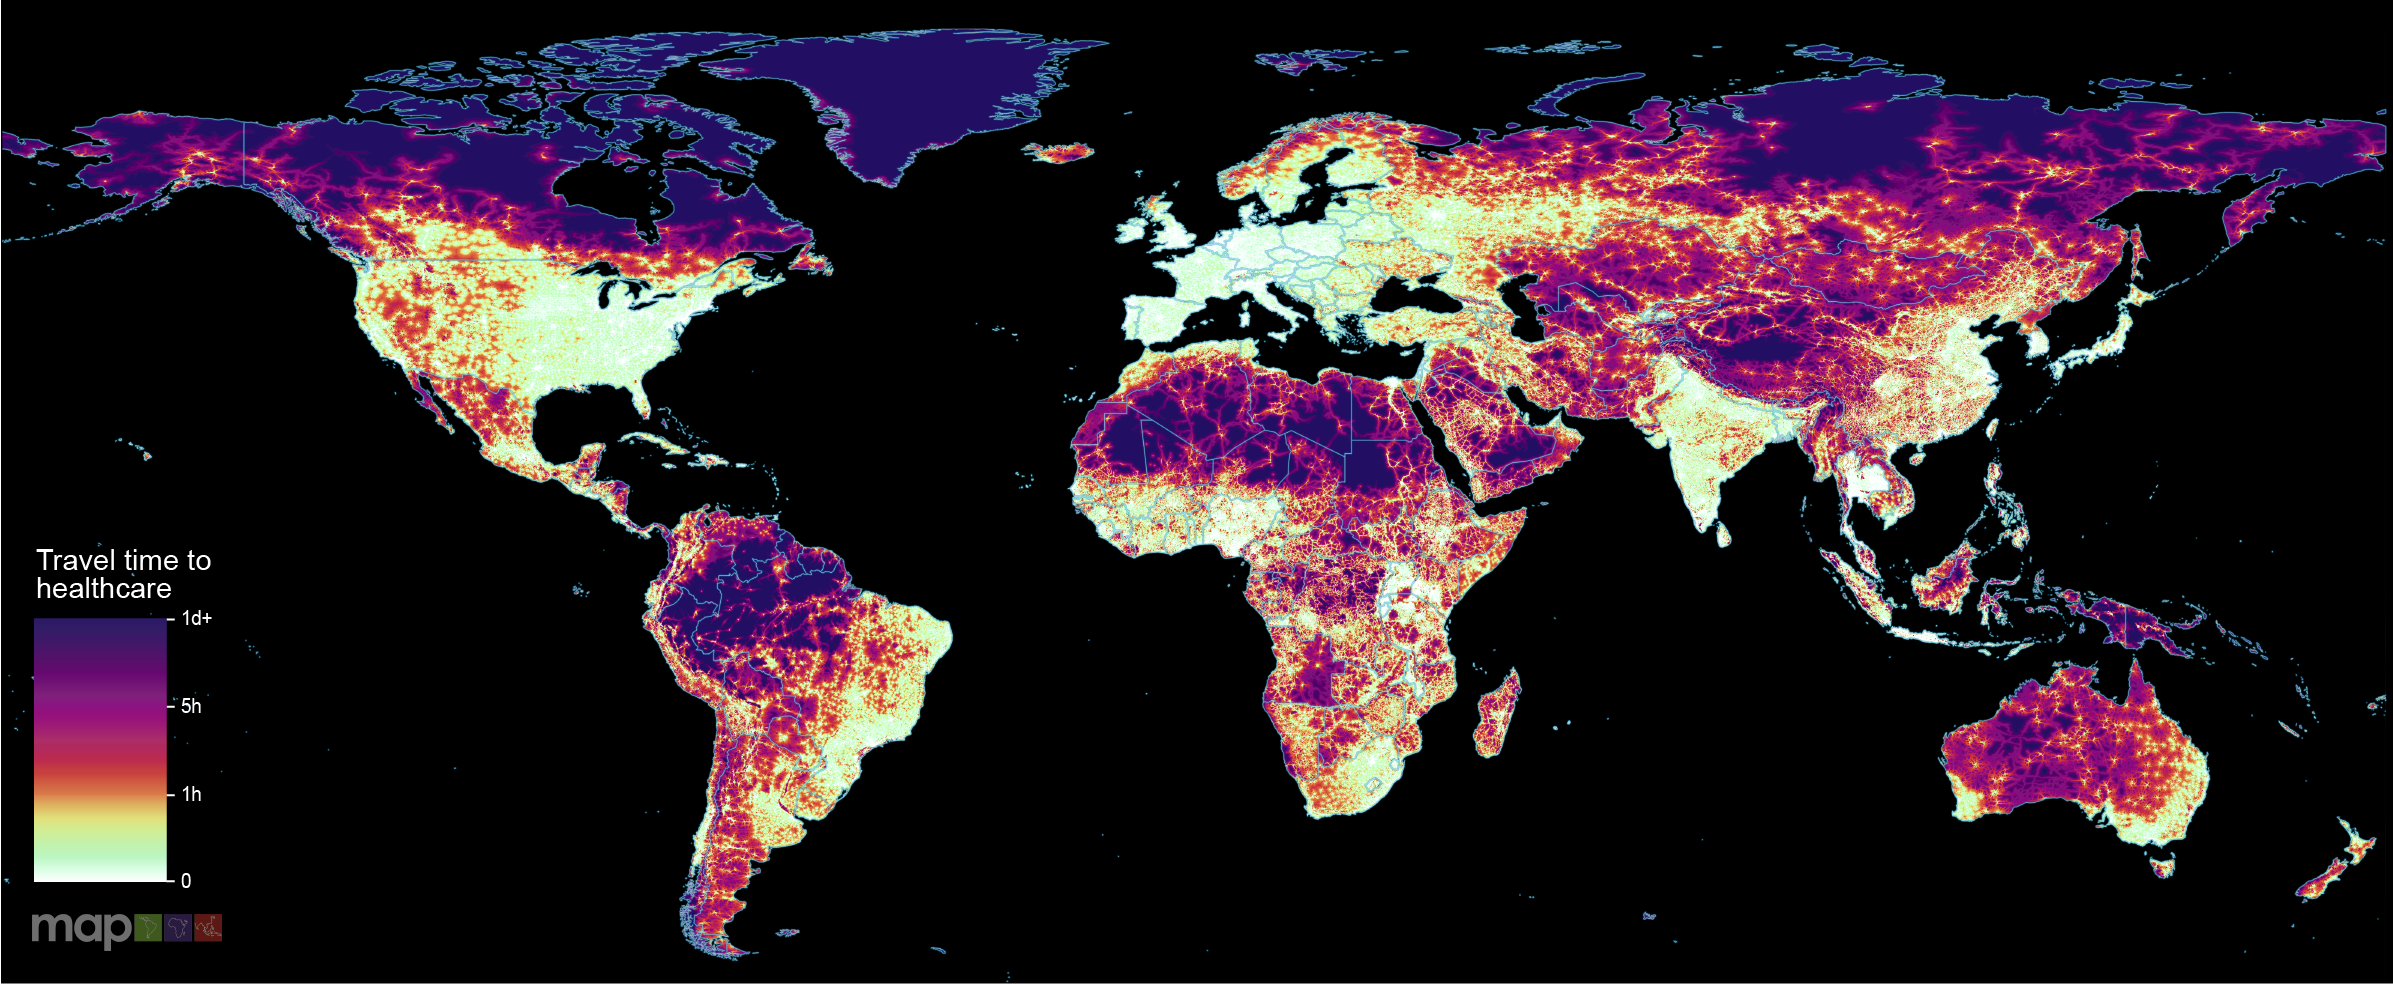
New research which maps the entire global population’s travel time to their nearest healthcare facility has revealed major inequalities in access to healthcare depending on whether people have access to motorised transport or not.

Children who live in the outer suburbs of Australia’s four biggest cities are twice as likely to have asthma as those living in inner city areas, according to a new study based on health data captured in the last Australian Census.
Since its inception in 2005, the US President's Malaria Initiative (PMI) has played a major role in the reductions in malaria morbidity and mortality observed across Africa. With the status of PMI funding and operations currently uncertain, we aimed to quantify the impact that a fully functioning PMI would have on malaria cases and deaths in Africa during 2025.
This study adds to the current literature by using a novel device-based method to explore where preschool children are physically active outside of home and childcare settings. This study combined accelerometry with geospatial data to explore the influence of the environment on preschool children's physical activity by objectively identifying the locations where preschool children engage in moderate to vigorous physical activity (MVPA) within and outside of their neighborhood.
Understanding the geospatial distribution of influenza infection and the risk factors associated with infection clustering can inform targeted preventive interventions. We conducted a geospatial analysis to investigate the spatial patterns and identify drivers of medically attended influenza infection across all age groups in Western Australia.